Selling your WPB condo?
Free Market Valuation →Downtown West Palm Beach Condo Market Report — September 2026
A data-driven look at Downtown West Palm Beach condos through September 2026 — the two slowest months of the year back to back, 4.6 months of supply that is anything but even across price tiers, and a pipeline that is now mostly new construction. Price tiers, building scorecards, and developer inventory from BeachesMLS.
BeachesMLS via FlexMLS, exported 2 October 2026 · Trailing 12 months, October 2025 – September 2026
September 2026 headline figures
| Metric | September 2026 | Month over month | Year over year |
|---|---|---|---|
| Median closed price | $540,000 | ▼ 11.1% | ▼ 4.4% |
| Median $/sq ft | $504 | ▼ 16.2% | ▲ 3.5% |
| Median days on market | 25 | ▼ 2.0% | ▼ 76.2% |
| Sale-to-list ratio | 94.0% | ▼ 1.7 pts | ▼ 0.4 pts |
| Closed sales | 17 | ▲ 6.2% | ▼ 32.0% |
| Months of supply | 4.6 | ▼ 0.8% | — |
Twelve-month figures for the same market: 294 closed sales, a $645,000 median price at $544 per square foot, 61 days median on market. 112 resale listings were active on 2 October 2026, or 4.6 months of supply.
Charts
Free to reuse with the credit line shown under each chart. Every image already carries the credit and this page's address.
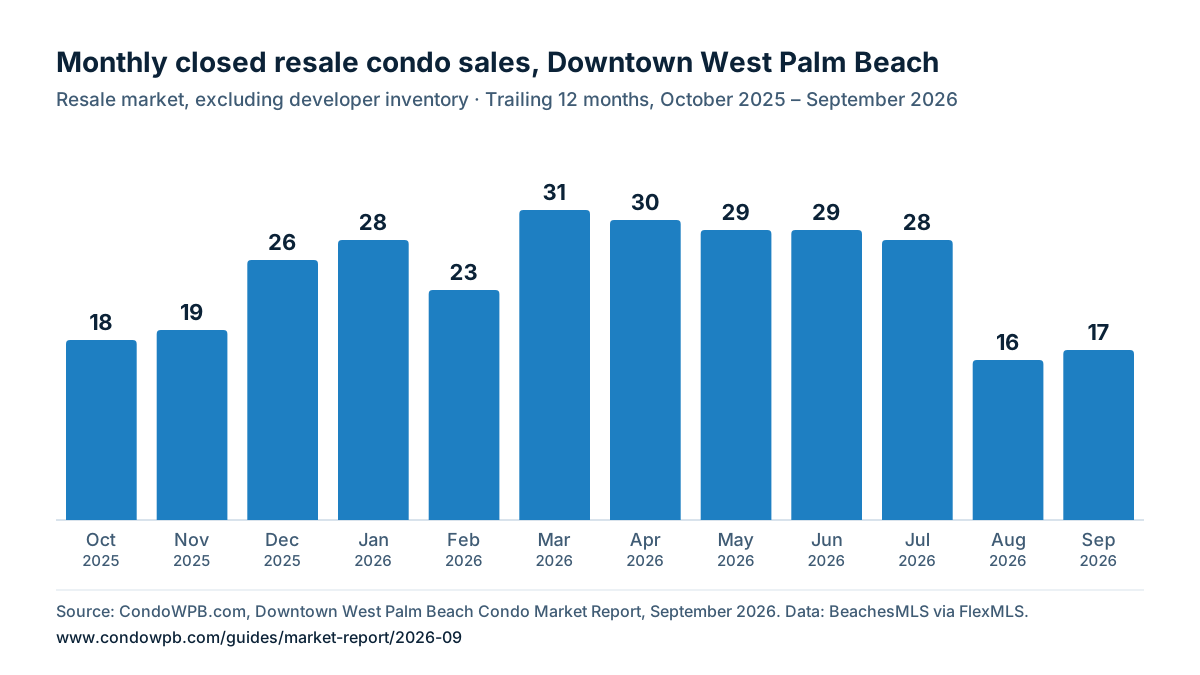
Source: CondoWPB.com, Downtown West Palm Beach Condo Market Report, September 2026. Data: BeachesMLS via FlexMLS.
Download PNG: Monthly closed resale condo sales, Downtown West Palm BeachView this chart's data as a table
| Month | Closed sales |
|---|---|
| Oct 2025 | 18 |
| Nov 2025 | 19 |
| Dec 2025 | 26 |
| Jan 2026 | 28 |
| Feb 2026 | 23 |
| Mar 2026 | 31 |
| Apr 2026 | 30 |
| May 2026 | 29 |
| Jun 2026 | 29 |
| Jul 2026 | 28 |
| Aug 2026 | 16 |
| Sep 2026 | 17 |
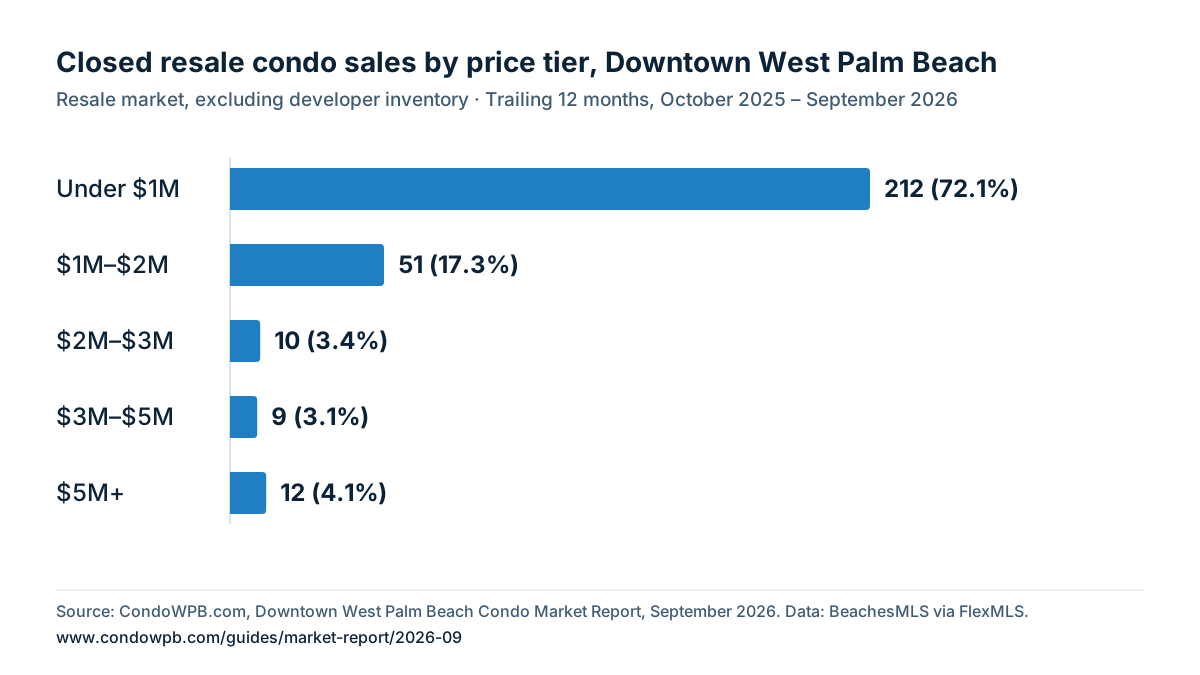
Source: CondoWPB.com, Downtown West Palm Beach Condo Market Report, September 2026. Data: BeachesMLS via FlexMLS.
Download PNG: Closed resale condo sales by price tier, Downtown West Palm BeachView this chart's data as a table
| Price tier | Closed sales (share of market) |
|---|---|
| Under $1M | 212 (72.1%) |
| $1M–$2M | 51 (17.3%) |
| $2M–$3M | 10 (3.4%) |
| $3M–$5M | 9 (3.1%) |
| $5M+ | 12 (4.1%) |
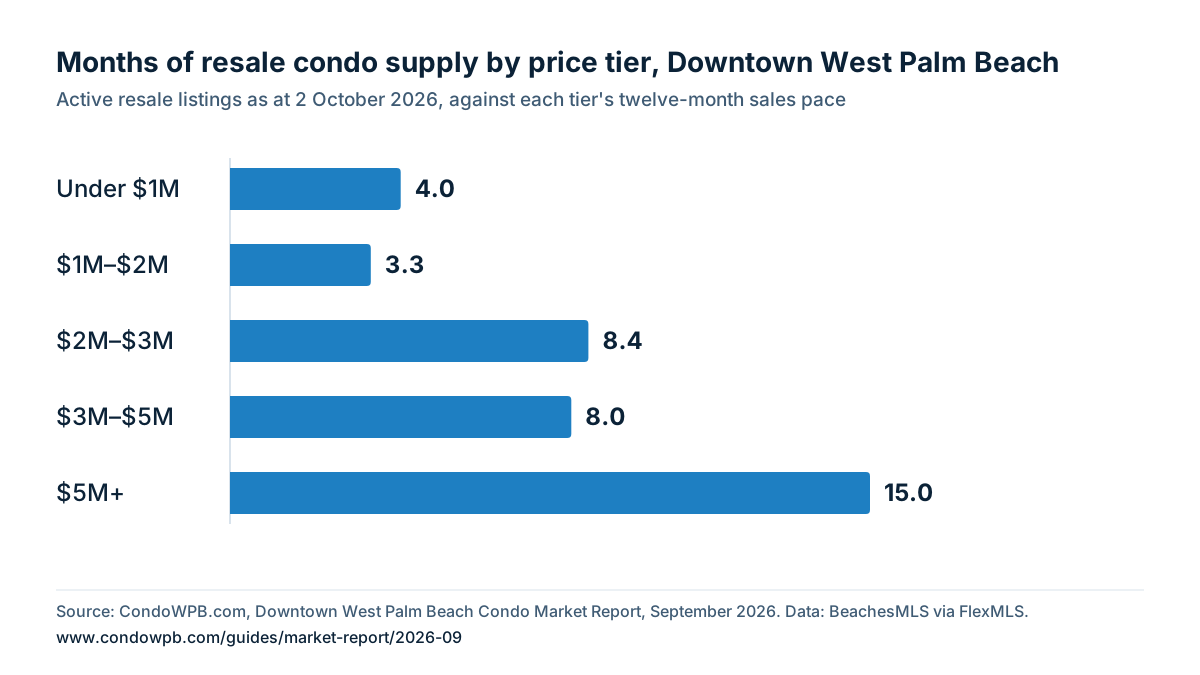
Source: CondoWPB.com, Downtown West Palm Beach Condo Market Report, September 2026. Data: BeachesMLS via FlexMLS.
Download PNG: Months of resale condo supply by price tier, Downtown West Palm BeachView this chart's data as a table
| Price tier | Months of supply |
|---|---|
| Under $1M | 4.0 |
| $1M–$2M | 3.3 |
| $2M–$3M | 8.4 |
| $3M–$5M | 8.0 |
| $5M+ | 15.0 |
Cite this report
- Title
- Downtown West Palm Beach Condo Market Report — September 2026
- Edition
- September 2026
- Publisher
- CondoWPB.com (DO Homes Group at Premier Brokers International)
- Permanent URL
- https://www.condowpb.com/guides/market-report/2026-09
- Data source
- BeachesMLS via FlexMLS, exported 2 October 2026
Suggested citation
CondoWPB.com. “Downtown West Palm Beach Condo Market Report — September 2026.” Data: BeachesMLS via FlexMLS, exported 2 October 2026. https://www.condowpb.com/guides/market-report/2026-09
This address always shows the September 2026 figures. Every edition is listed in the market report archive.
Methodology
- Data sourced from BeachesMLS via FlexMLS, exported 2 October 2026.
- Scope: condominiums in ZIP 33401 and 33407 east of I-95, list price $350,000 and above.
- Resale figures exclude nine developer-controlled new-construction buildings, which sell mostly through direct developer contracts that never reach the MLS. Those buildings are reported separately as developer inventory.
- Buildings are matched by street address, not subdivision name.
- Sale-to-list ratio compares the closed price with the last list price.
- Months of supply is active listings divided by the average monthly sales pace over the past twelve months. Each price tier uses its own sales pace.
What changed this month: resale figures now exclude nine developer-controlled buildings (previously four), cover the downtown core east of I-95, and correct several building assignments — Flagler Pointe, Norton Park Place, Viking Arms and La Fontana are now reported under their own names. Forté on Flagler, delivered in 2025, is counted as resale. Every month-over-month and year-over-year comparison was recalculated on the same basis, so figures here will not match the August edition.
This report is for informational purposes and does not constitute an appraisal. Median figures can be influenced by small sample sizes, particularly in the higher price tiers, at individual buildings with few closings in the period, and in any single month before its closings have fully posted.
Full analysis and building-level data
A newer edition has been published. See the latest market report for current figures; this page keeps the September 2026 numbers as published.
Writing about the West Palm Beach condo market? Our archive lists every edition by month.
Sell with Christine & John
Thinking of Selling
Your WPB Condo?
Christine & John know your building better than any generalist agent — every closed comp, every active listing, every competing new construction project in your price range. That's how you price right the first time.
We Know These Buildings
Deep WPB condo market knowledge — we track every building, comp set, and price trend so your listing is priced right from day one.
condowpb.com Buyer Pipeline
Our site attracts active condo buyers — your listing is in front of them before we run a single ad.
Pricing Backed by Data
We track resale history and price trends for every building in the market. We price with data, not estimates.
Certified Seller Representation
John holds the SRS designation — a national credential for advanced seller representation held by fewer than 5% of agents. Both agents hold RENE.
2017
Team Founded
3x
Platinum Producers
43+
Buildings Tracked